so you can report off of it.
Note: I actually profile my Databases completely different than what is presented here, but this information might be useful to someone else.
If you have Microsoft SSIS, then you can take advantage of the Data Profiling Task. It profiles your tables and columns and outputs an XML file. You then have the option to view that XML file with the Data Profile Viewer that got installed with SSIS. That tool makes pretty bar charts for you, but that’s it. You cannot compare the profile results from different dates, etc.. You wish… that the data was stored in your database.
Likewise, Ataccama offers a free profiling tool called DQ Analyzer. It has a much better UI than the SSIS Data Profiling Task and offers many more features, and it’s free. One has the option to export profile results to an xml file. Here again, though, the free version does not allow you to plot the results against previous profile results, etc.. and you also end up wishing… that the data was stored in your database.
I won’t bore you with how to get the XML into your database. You can google that. I created a table named DataQualityXml and put the xml in a column named DQX_Xml. Once there, you can turn the hierarchical XML into rows using the queries below.
See my earlier post about how to operationalize this pattern.
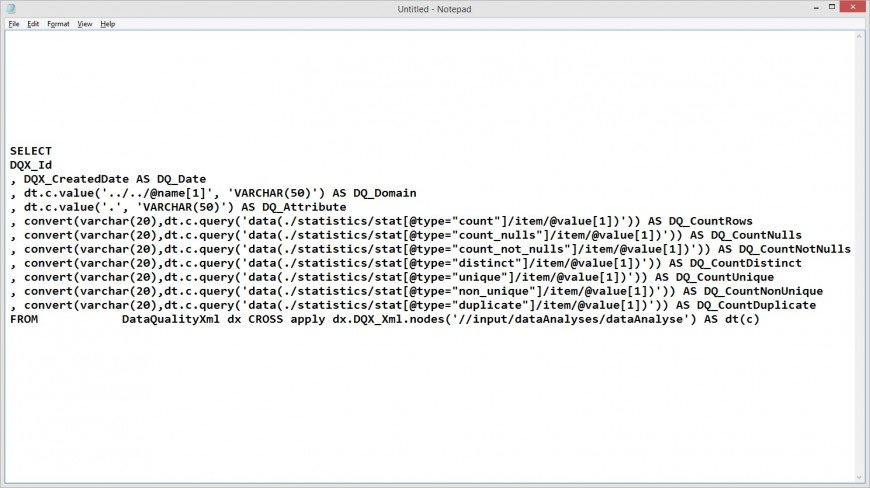
Here is how to Query the Profile XML from Ataccama DQ Analyzer:
SELECT
DQX_Id
, DQX_CreatedDate AS DQ_Date
, dt.c.value(‘../../@name[1]’, ‘VARCHAR(50)’) AS DQ_Domain
, dt.c.value(‘.’, ‘VARCHAR(50)’) AS DQ_Attribute
, convert(varchar(20),dt.c.query(‘data(./statistics/stat[@type=”count”]/item/@value[1])’)) AS DQ_CountRows
, convert(varchar(20),dt.c.query(‘data(./statistics/stat[@type=”count_nulls”]/item/@value[1])’)) AS DQ_CountNulls
, convert(varchar(20),dt.c.query(‘data(./statistics/stat[@type=”count_not_nulls”]/item/@value[1])’)) AS DQ_CountNotNulls
, convert(varchar(20),dt.c.query(‘data(./statistics/stat[@type=”distinct”]/item/@value[1])’)) AS DQ_CountDistinct
, convert(varchar(20),dt.c.query(‘data(./statistics/stat[@type=”unique”]/item/@value[1])’)) AS DQ_CountUnique
, convert(varchar(20),dt.c.query(‘data(./statistics/stat[@type=”non_unique”]/item/@value[1])’)) AS DQ_CountNonUnique
, convert(varchar(20),dt.c.query(‘data(./statistics/stat[@type=”duplicate”]/item/@value[1])’)) AS DQ_CountDuplicate
FROM DataQualityXml dx CROSS apply dx.DQX_Xml.nodes(‘//input/dataAnalyses/dataAnalyse’) AS dt(c)
The XML produced by SSIS is much more complicated. Additionally, you also need to declare the namespace. I went ahead and did some aggregations so you can see what more can be done. This SQL assummes that the respective DataQualityXml table and columns have already been created and populated.
Here is how to Query the Profile XML that SSIS generates:
select
A.DQX_Id as Profile_Id
,A.DQ_Date as Profile_Date
,A.DQ_Domain as Domain
,A.DQ_Attribute as Attribute
,sum(A.DQ_CountRows) AS Row_Count
,sum(A.DQ_CountDistinct) as Distinct_Count
,sum(A.DQ_CountNulls) as Null_Count
from
(
SELECT
DQX_Id
, DQX_CreatedDate AS DQ_Date, dt.c.value(‘declare namespace p=”http://schemas.microsoft.com/sqlserver/2008/DataDebugger/”; ./p:Table[1]/@Table’, ‘VARCHAR(50)’) AS DQ_Domain
, dt.c.value(‘declare namespace p=”http://schemas.microsoft.com/sqlserver/2008/DataDebugger/”; ./p:Column[1]/@Name’, ‘VARCHAR(50)’) AS DQ_Attribute
, Convert(int, Convert(varchar(10), dt.c.query(‘declare namespace p=”http://schemas.microsoft.com/sqlserver/2008/DataDebugger/”; data(./p:Table/@RowCount)’))) AS DQ_CountRows — ColumnValueDistributionProfile
, Convert(int, Convert(varchar(10), dt.c.query(‘declare namespace p=”http://schemas.microsoft.com/sqlserver/2008/DataDebugger/”; data(./p:NumberOfDistinctValues)’))) AS DQ_CountDistinct — ColumnValueDistributionProfile
, 0 AS DQ_CountNulls — ColumnNullRatioProfile
FROM DataQualityXml dx CROSS apply dx.DQX_Xml.nodes(‘declare namespace p=”http://schemas.microsoft.com/sqlserver/2008/DataDebugger/”; //p:ColumnValueDistributionProfile’) AS dt(c)union ALL
SELECT
DQX_Id
, DQX_CreatedDate AS DQ_Date, dt.c.value(‘declare namespace p=”http://schemas.microsoft.com/sqlserver/2008/DataDebugger/”; ./p:Table[1]/@Table’, ‘VARCHAR(50)’) AS DQ_Domain
, dt.c.value(‘declare namespace p=”http://schemas.microsoft.com/sqlserver/2008/DataDebugger/”; ./p:Column[1]/@Name’, ‘VARCHAR(50)’) AS DQ_Attribute
, 0 AS DQ_CountRows — ColumnValueDistributionProfile
, 0 AS DQ_CountDistinct — ColumnValueDistributionProfile
, Convert(int, Convert(varchar(10), dt.c.query(‘declare namespace p=”http://schemas.microsoft.com/sqlserver/2008/DataDebugger/”; data(./p:NullCount)’))) AS DQ_CountNulls — ColumnNullRatioProfile
FROM DataQualityXml dx CROSS apply dx.DQX_Xml.nodes(‘declare namespace p=”http://schemas.microsoft.com/sqlserver/2008/DataDebugger/”; //p:ColumnNullRatioProfile’) AS dt(c)
) A
group by
DQX_Id
,DQ_Date
,DQ_Domain
,DQ_Attribute